The Stats page of the WPResidence real estate CRM is your performance dashboard. Five KPI tiles summarize the state of your business at a glance, and six interactive charts go deeper into where your activity is.
Opening the Stats Page
Click CRM → Stats. What you see depends on your role: admins see stats for the whole system; agents see stats scoped to the contacts, deals, and tasks they own.
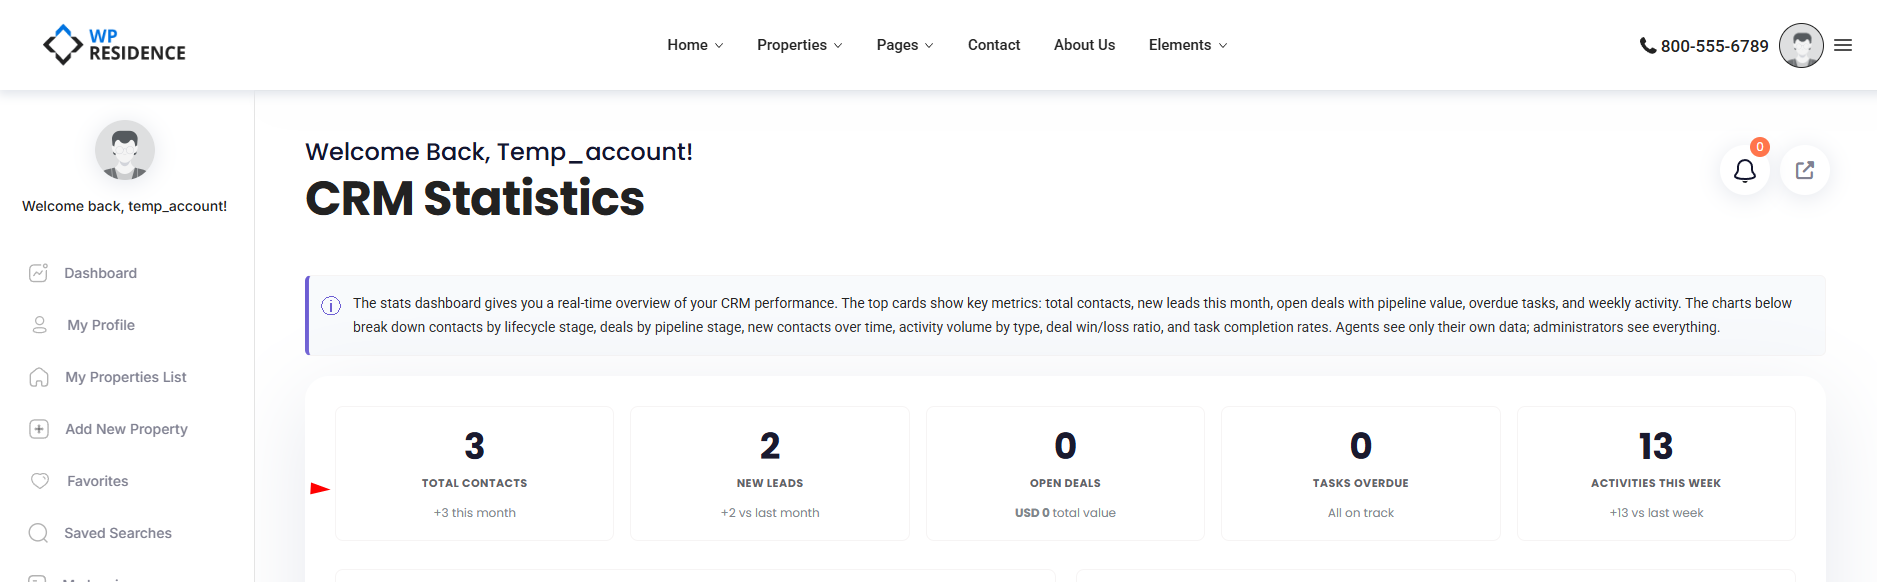
The Five KPI Tiles
| Tile | What it shows |
|---|---|
| Total Contacts | Full contact count, with a delta for this month. |
| New Leads | Leads this month vs. previous month. |
| Open Deals | Active deals plus total open pipeline value. |
| Overdue Tasks | Tasks past their due date. Highlighted red when greater than zero. |
| Weekly Activities | Activity count this week vs. last week. |
The deltas (this-month vs. previous, this-week vs. last) make trends visible without you having to click anything.
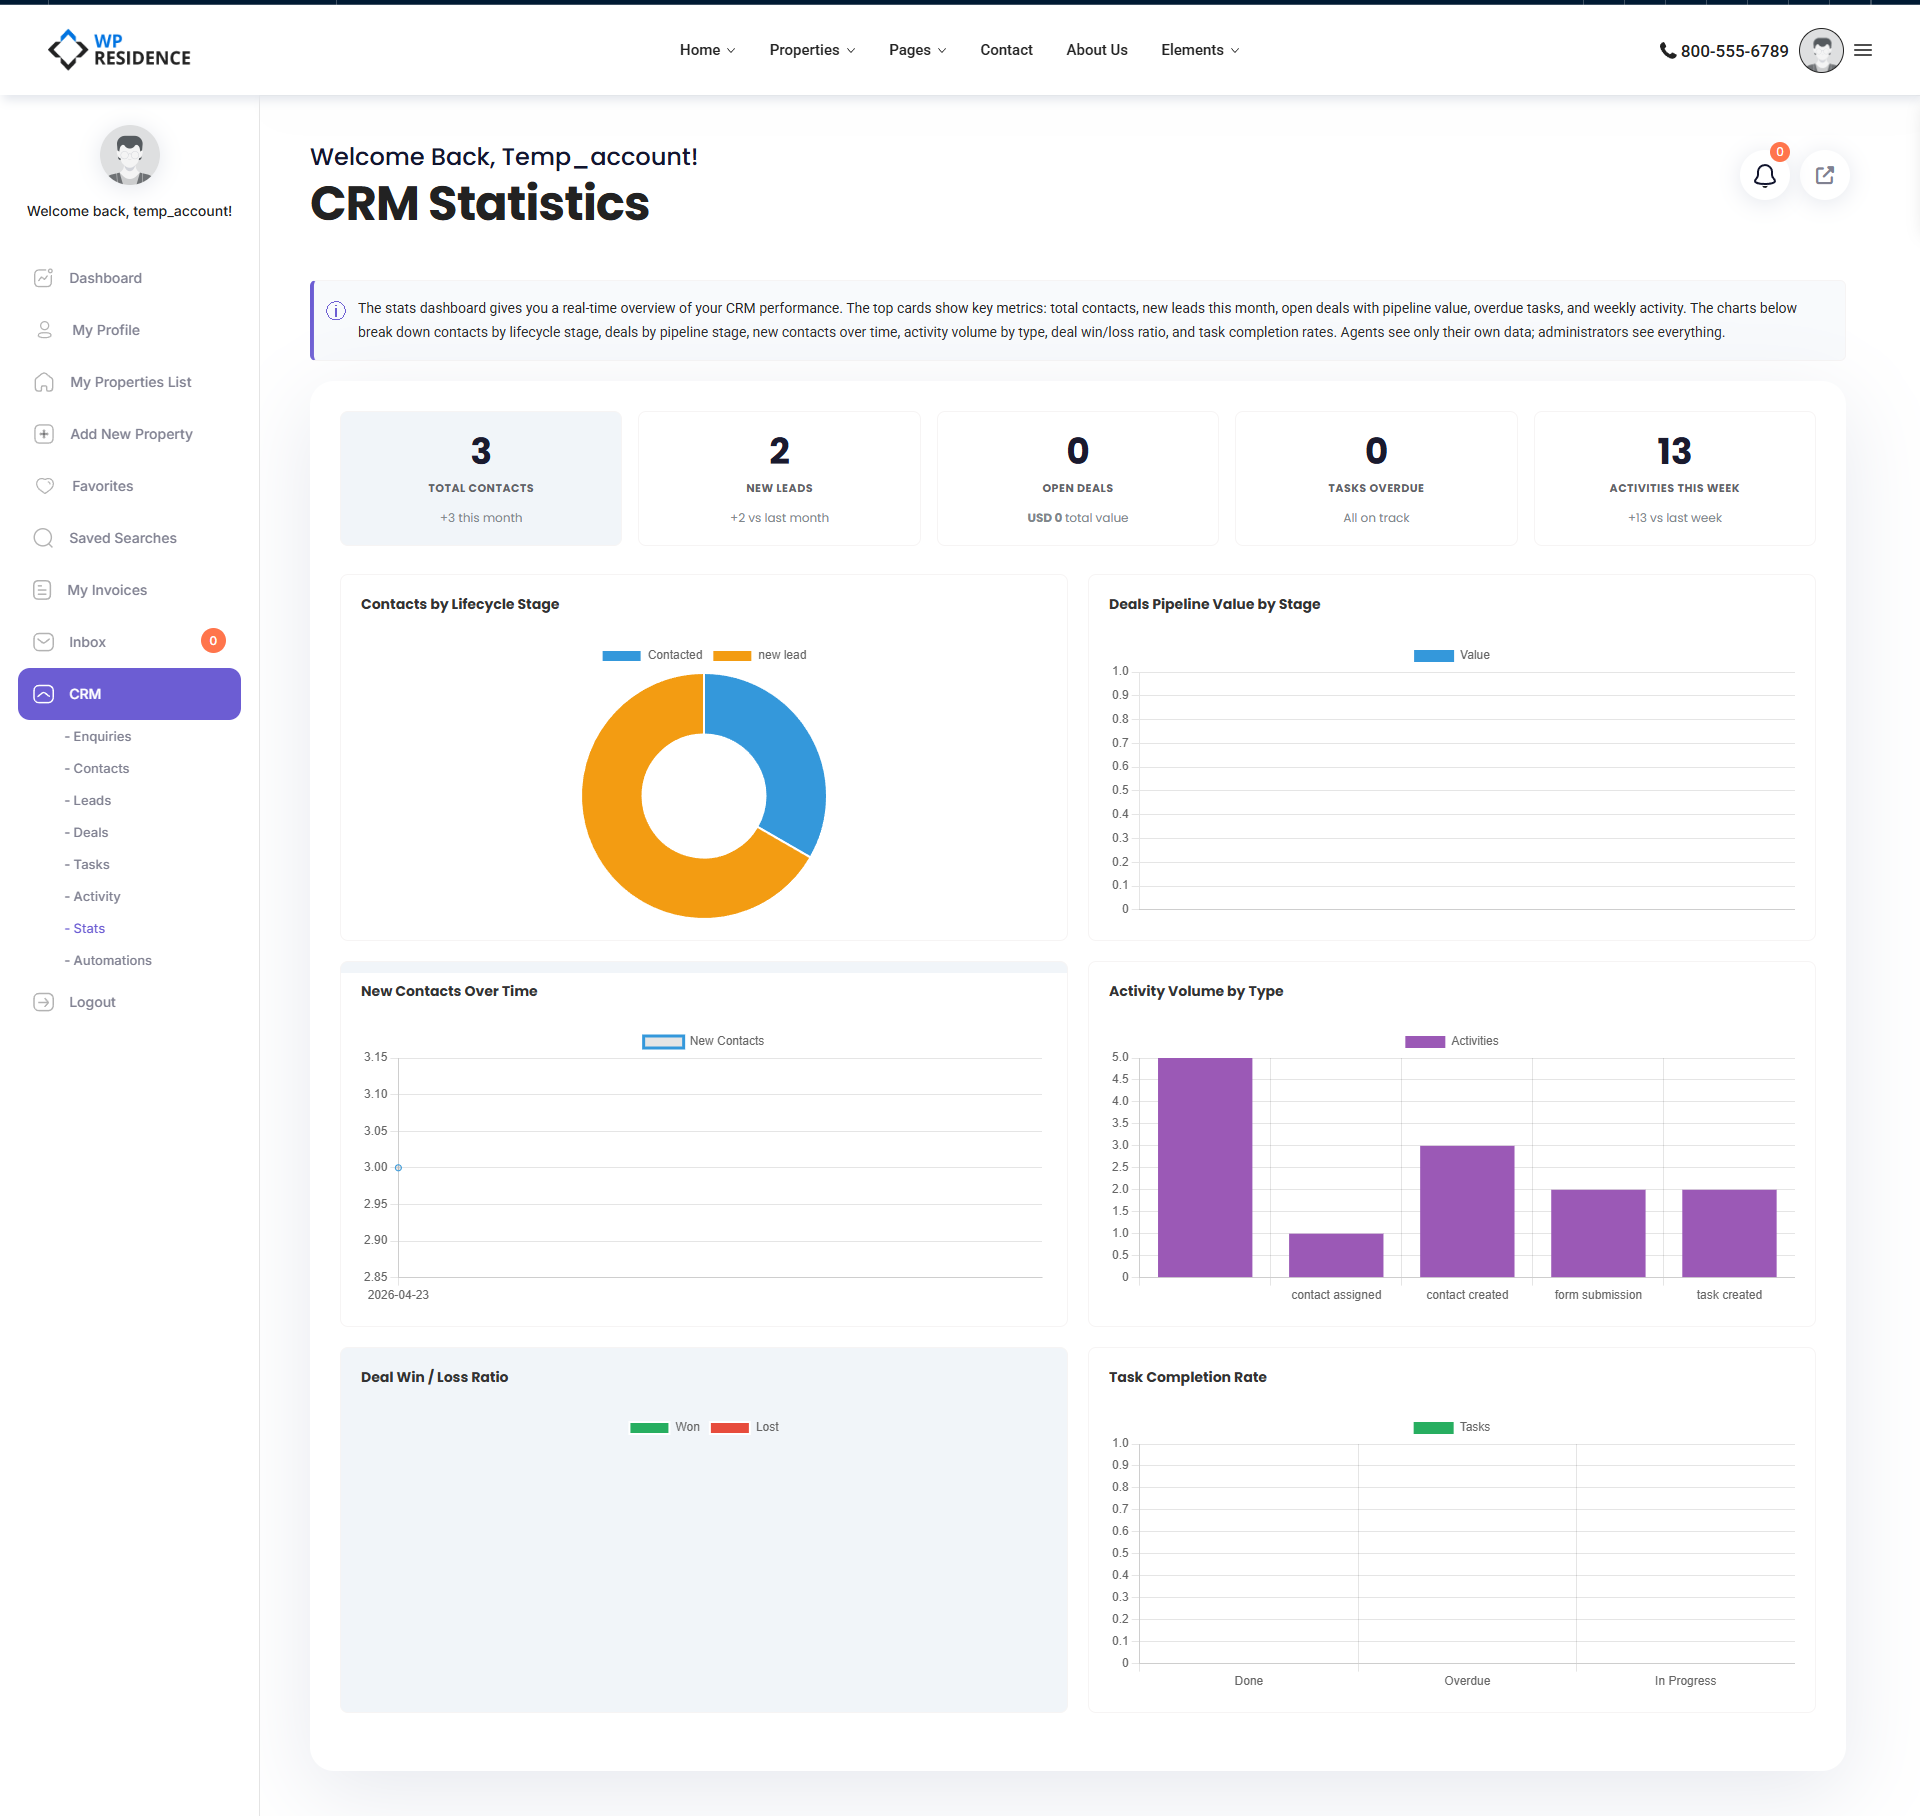
The Six Charts
Below the tiles, six charts load shortly after the page appears (so the page itself stays fast):
- Contacts by Lifecycle Stage — doughnut chart showing how many contacts sit in New Lead, Contacted, Active Client, and so on.
- Deals by Pipeline Stage — bar chart with one bar per stage, showing count and total value.
- New Contacts over Time — 30-day rolling line chart.
- Activity Volume by Type — bar chart of recent activities grouped by type (notes, calls, forms, etc.).
- Deal Win/Loss Ratio — pie chart of won vs. lost deals.
- Task Completion Rate — bar chart showing completed vs. total tasks.
How to Read the Charts
Contacts by Lifecycle Stage
A healthy funnel narrows from left to right. If you have 500 New Leads and 10 Active Clients, your conversion is leaking somewhere between the two.
Deals by Pipeline Stage
Look at both count and value. A single high-value deal in Negotiation can matter more than ten small ones in Offer Made.
New Contacts over Time
Steady flow is good. Spikes can mean a successful campaign; drops can mean your lead sources have dried up.
Activity Volume by Type
If most of your activity is form_submission with little call or note, you are letting inbound leads sit. Balance it.
Deal Win/Loss
Over time, your win ratio should hold steady or improve. A sudden swing means something changed (market, pricing, a new competitor).
Task Completion
A completion rate under 60% usually means you are creating tasks faster than you can finish them — a signal to delegate, automate, or be more selective.
Who Sees What
- Administrators see aggregated stats across every agent.
- Agents see only their own data — their contacts, their deals, their tasks.
This makes the Stats page useful for both the company owner checking overall performance and individual agents tracking their personal pipeline.
What the Page Does NOT Show
There are no date-range pickers on every chart — ranges are fixed (this month, last 30 days, this week). There are no export-to-PDF or export-to-CSV actions on the Stats page itself; for that, use the Activity page or the CSV Export feature described in the CSV Import / Export article.
Making Your Stats Better
- Log every call. If your Activity Volume chart is only form submissions, it means real work is invisible.
- Close out deals. Don’t leave lost deals in open stages — it skews your pipeline value.
- Complete or delete tasks. Overdue tasks age badly on the red-highlighted tile.
- Review monthly. Set a recurring reminder to compare this month vs. last.